October 19, 2007 Technical Analysis: October Flexes Its Muscles By Paul ShreadAs we
noteda week ago, caution was warranted through October 29, and the market is
so far proving that observation correct. Investors Intelligence
bulls-bears have hit nosebleed levels of 62-19, but commercial futures
traders remain long the
big S&P futures contract,
so we have a mixed picture in sentiment, but one that could stand a
refresher. Hopefully this pullback will do that just in time for the
strongest months of the year, which begin at the end of the month. On
the plus side, today's overwhelming downside volume could provide fuel
for a near-term bounce. The
S&P and Nasdaq (first two charts below) continue to wrestle with
some very important long-term resistance levels, and so far they've
shown that they're not up to the task. Perhaps year-end buying will
change that, but it's equally likely that it could produce a top of
some significance. The
S&P has major support at 1496-1497 — below that and the 200-day
average at 1477 (and rising) could come into play. To the upside, it
would take a move to about 1535 to break the index's downtrend. The
Nasdaq ended the day at 2725 support; next up is 2700, 2675 and 2650,
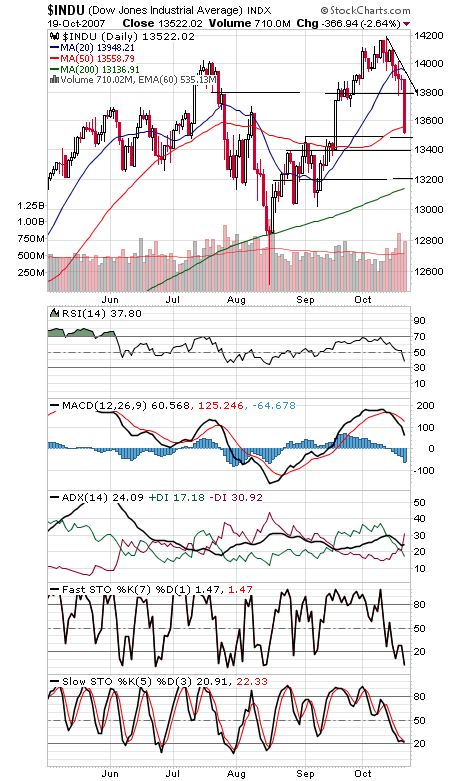
and 2755 is first resistance. The Dow (third chart) is another index
right at major support (13,494). Below that, 13,400 and 13,200 are
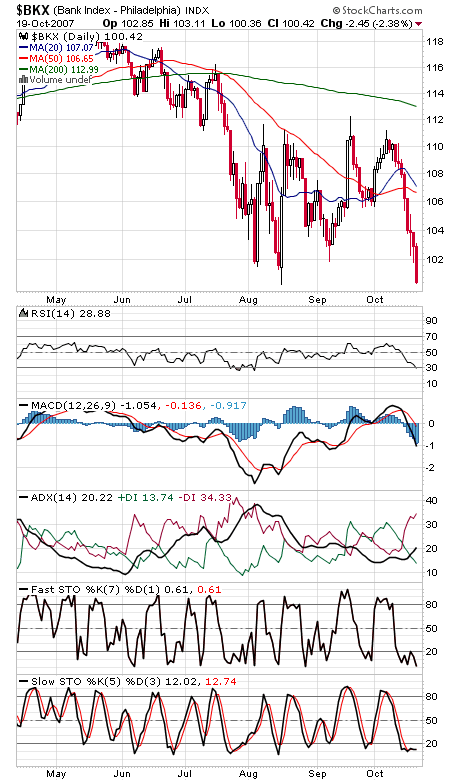
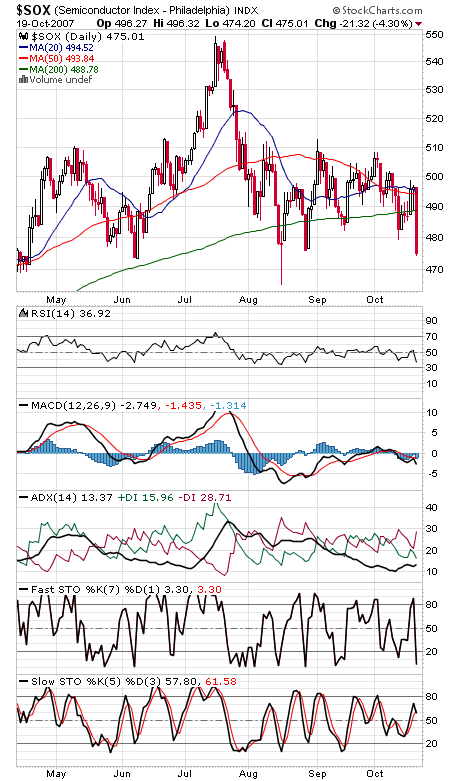
possible supports, while 13,560 and 13,800 are resistance. With
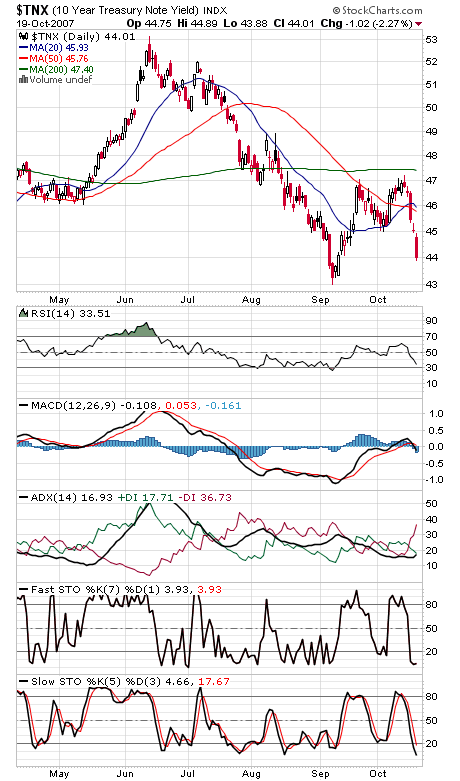
the banks and chips leading the way lower (charts four and five), bond
traders (sixth chart) have begun to price in another Fed rate cut or
two at the end of the month. And with good reason.
Paul Shread is a Chartered Market Technician (CMT) and member of the Market Technicians Association.