gastaoss
Number of posts : 440
Registration date : 2007-07-01
 | Subject: Charting Stocks  Tue Aug 21, 2007 1:18 am Tue Aug 21, 2007 1:18 am | |
| | |
|
gastaoss
Number of posts : 440
Registration date : 2007-07-01
| | Subject: 2007 Stock Market Crash Update Tue Aug 21, 2007 1:19 am | |
| 2007 Stock Market Crash Update Charting Stocks Update
August 19, 2007“The US government is on a ‘burning platform’ of
unsustainable policies and practices with fiscal deficits, chronic
healthcare underfunding, immigration and overseas military commitments
threatening a crisis if action is not taken soon.
..These include “dramatic” tax rises, slashed government services and
the large-scale dumping by foreign governments of holdings of US debt.”-David Walker, Comptroller General of the United States, 2007
My readers know that I began the year calling for a crash of the stock
market in 2007. You can read my piece I wrote on January 1, 2007 by clicking here. At the time, the market seemed invincible and my view came across as radical and was extremely unpopular.
During the past few weeks the Dow Jones lost about 1200 pts in a
selloff that was fast and violent. The optimistically bias media seemed
to be in a state of shock as the markets rolled over and called the
movement a “pullback” and “buying opportunity.” IT IS ANYTHING BUT!
Sure, the market is oversold and we should see a near term rally which
may carry the Dow close to the old high of 14,000 (Though I think
13,500 or so is more likely). I think that smart money will be using
the rally to lighten up on equity before the next major decline which
should last several years.“Keep your eyes off of the news and on the charts!”
-John MurphyShould you believe the “Experts?” Below are two quotes I
found from well respected economists in September 2005 calling for a
continuation in higher home prices. (At the same time that the DJ US
Home Construction Index broke an uptrend and registered a sell signal).September 27, 2005
David A. Lereah, chief economist for the Realtors association, said
that with a growing U.S. population and tight housing inventory, “we’ll
continue to see above-normal home price appreciation for the
foreseeable future.” September 27, 2005.September 25, 2005
“I don’t use the word ‘bubble’ because I don’t think there is one,”
said Raphael Bostic, an economist and director of USC’s master of
real-estate development program. “Bubble is a word that you use to
characterize markets that are irrational, that don’t have underlying
economic fundamentals to explain what’s going on. I don’t think that’s what’s really going on in today’s housing market.”  I’ve written previously about the importance of the Broker I’ve written previously about the importance of the Broker
stocks in the overall market. “Where the broker/dealers go, so goes the
market.” Here we can clearly see a sell signal has finally been given.
More importantly, the relative strength of the index to the S&P500
has finally broken support which is an indicator of a new bear market
for stocks. The next two charts were some of the worst hit in the The next two charts were some of the worst hit in the
index–Bear Stearns and Lehman Brothers. Both have broken support levels
on extremely high volume. I’d expect a short term rally in the
days/weeks to come in the broker stocks before the next major move down. | |
|
gastaoss
Number of posts : 440
Registration date : 2007-07-01
| | Subject: Re: Charting Stocks Tue Aug 21, 2007 1:19 am | |
|   The Volatility Index (VIX) is also a good indicator of The Volatility Index (VIX) is also a good indicator of
market bottoms and tops. Volatility tends to spike at both extremes as
we can the in the chart below. The VIX spiked at the beginning of this
current bull market and has declined as the market moved higher. The
recent spike in the VIX reinforces my argument of a new bear market.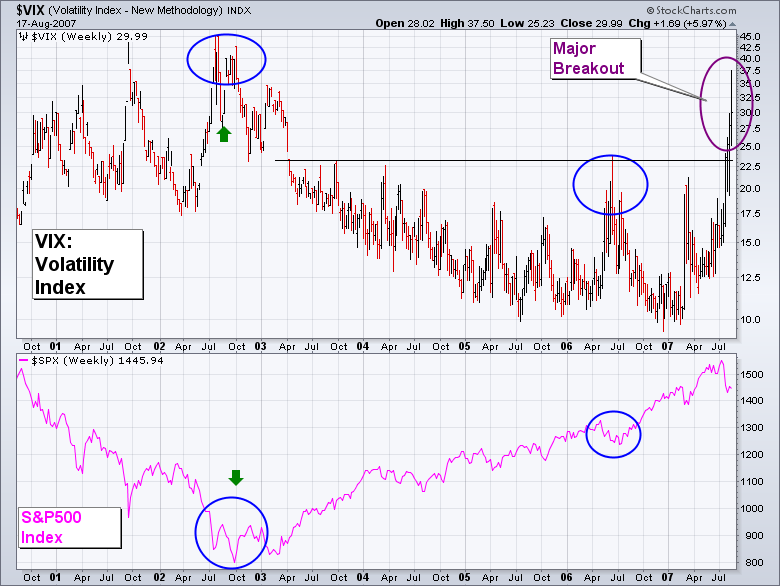 Next, we can see the relationship between US stocks and the Next, we can see the relationship between US stocks and the
Japanese Yen. Japan has been a global source for cheap money and has
fueled much of the worlds borrowed expansion. As Japans economy
improves, inflationary pressures emerge, rates move higher and the Yen
strengthens, which can suck liquidity out of the markets. So it’s no
suprise that as the Yen moves higher, stocks decline. The chart below
illustrates that. The Dow Jones is an Index made of of 30 Blue Chip stocks. The Dow Jones is an Index made of of 30 Blue Chip stocks.
They are considered to be some of the safest US equity investments.
When the Dow is under performing the rest of the market, it is actually
a good sign. A sign that investors are more confident and willing to
take on more risk as the buy non-dow 30 stocks. The chart below is the
Dow relative to the market. When the line is moving down, the dow is
under performing the market, and this tends to happen in bull markets.
We can clearly see the line bottom in early 2000, which was the
beginning of a bear market. It also gave a good signal when in broke
the uptrend in 2002 and signaled a bull market. The line declined all
through the recent bull market, but has recently broken out. This
indicator gives pretty accurate readings, and it reaffirms by bear case.
Short term T-bill rates signal a bear market in the making. Below you
can see the recent downward move in T-bill rates and compare it to the
last time this has happened. Still Bullish?? Are Republicans bad for the US Dollar? I came across and Are Republicans bad for the US Dollar? I came across and
interesting chart and thought I’d add it. This isn’t a political
statement of any sort, though the evidence seems to strongly point to
the conclusion that Republican Presidents are not good for the Dollar.
(Could be all of the tax cuts?) Bottom Line- In my view, the stock market should experience Bottom Line- In my view, the stock market should experience
a short term rally over the next couple of weeks. Then, I believe that
a major downturn will occur and should last for several years.This
should be the worst bear market that this country has experienced since
the Great Depression. The similarities are striking. An economic
expansion led by borrowed money. In the 20s, the US experienced a major
real estate expansion. Florida led the move higher before collapsing in
1927 (As it started doing in 2005). The rest of the country sooned
followed, as did the stock market in 1929.
The United States is on the verge of bankruptcy and this house of cards is coming down. And soon. | |
|
Sponsored content
| | Subject: Re: Charting Stocks | |
| |
|


